Updated September 2026. Originally published August 2024.
Most marketing teams cannot answer two questions about their own work.
What does one sales appointment cost us, and what is one worth?
Until you can answer both, marketing is a budget line that gets argued about, and every bad quarter turns into the same conversation about whose fault it is. Once you can answer both, it becomes unit economics, and the argument stops.
This article sets out how to get to those two numbers, and how to avoid the two mistakes that make them look better than they are.
The five numbers I actually track
Not a dashboard of thirty metrics. Five.
- Cost per appointment. Total sales and marketing cost divided by appointments set.
- Cost per appointment held. The same cost divided by appointments that actually happened.
- Cost per customer. The same cost divided by customers won.
- Total MRR. What the whole machine is producing in recurring revenue.
- Profit as a share of MRR. Because revenue is not the thing you keep.
The second one is the one almost nobody tracks, and it is the most useful of the five.
Why held is the number that matters
An appointment that is set and never happens has consumed your entire acquisition cost and produced nothing. It is not a partial result. It is a total loss wearing the costume of a win.
If you measure only appointments set, no-shows are invisible, and worse, they are rewarded. A team hitting a booking target has no reason to care whether the meeting occurs.
There is a second reason it matters, and it is the one people miss. Marketing books the appointment. Sales holds it. The show rate sits on the handoff between two functions, so it belongs to neither of them alone and gets owned by neither unless you deliberately put a number on it.
In the example below, a 75 percent show rate makes every real conversation a third more expensive than the booking figure suggests. That third is invisible on both teams’ dashboards.
The standard that ends the argument
None of this works while the two sides mean different things by the word appointment. Everything above is arithmetic, and arithmetic settles nothing if the inputs are disputed.
So write down what qualifies, and get it signed by three parties: marketing, sales, and the chief executive. The third signature is the one that makes it stick.
An ideal customer profile that can actually be used as a gate looks like this:
- Size band. Businesses of 10 to 200 employees, not a vague sense of who fits.
- Geography. The specific markets you serve, named.
- Exclusions. The sectors you have consistently failed to win, stated as exclusions rather than quietly hoped against.
- Who is in the room. An owner, chief executive or general manager attends the meeting.
That last criterion is the one that changes the measurement, because you cannot verify it until the meeting happens. Fit is therefore assessed on held appointments, not on booked ones, and the gate belongs in the chain after the show rate rather than before it.
The agreed close rate is a constant
Here is the mechanism, and it is the most useful thing in this article.
Once all three parties have agreed the profile, they also agree the close rate to expect against it. Say 12 percent. That number does not move because sales missed it. It is the standard, not the outcome.
Which means marketing’s contribution is settled the moment the qualified held appointments are counted. Deliver 41 appointments that meet the agreed profile and the contribution is 41 at 12 percent, valued at your average revenue. That figure stands whether sales converts at 12 percent, at 8, or at 20.
If the actual rate comes in under the agreed one, that is a sales conversation, and it now has a number on it rather than a mood. In the example below, closing at 8 percent instead of 12 leaves roughly $2,500 of monthly recurring revenue on the table, from appointments that were already paid for and already qualified.
Marketing stops defending its budget. Sales stops absorbing blame for lead quality it did not control. Both are measured against something they agreed to in advance, which is the only version of this that survives a bad quarter.
The calculation
Two mistakes this calculation invites
Before the numbers, the two errors that turn this from a useful measure into a flattering one. Both are common, both are easy to make, and both push in the same direction.
Mixing time horizons. Lifetime value covers months or years. Costs are usually quoted monthly. Subtract one month of cost from several years of revenue and the result is meaningless, and meaningless in the direction that makes marketing look good. Keep both sides on the same clock: monthly against monthly, or lifetime value against fully loaded acquisition cost.
Using revenue instead of contribution. If lifetime value is revenue per customer multiplied by months retained, it ignores what serving that customer costs you. For any business that has to deliver something after it sells, that overstates every account by the whole cost of delivery. Apply gross margin before you call anything value.
The version of this article I published in 2024 made both, so this is a warning I have earned rather than borrowed. A CFO would find either one in a minute, which is the standard I would apply to your own numbers and the reason I argue for engineering your go to market like a CFO.
Forward, from cost to value
All figures here are illustrative and chosen to be round. Use your own.
- Monthly sales and marketing cost: $60,000
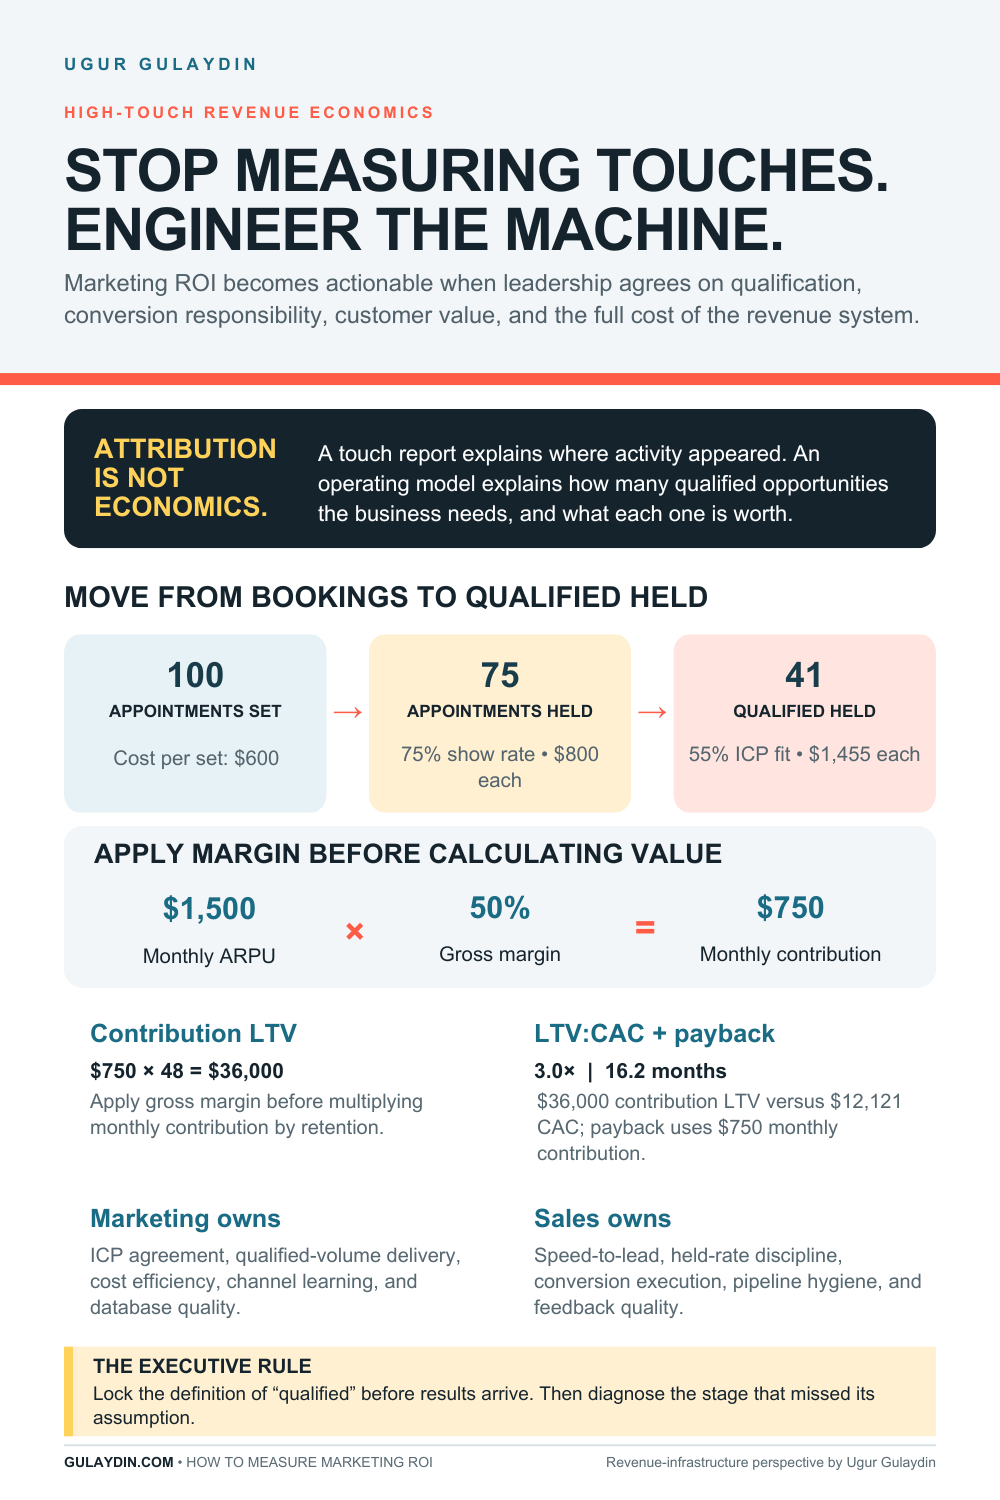
- Appointments set: 100, so cost per appointment is $600
- Show rate 75 percent, so 75 held, and cost per appointment held is $800
- ICP fit 55 percent of held, so 41 qualified appointments, and cost per qualified appointment is $1,455
- Agreed close rate 12 percent, so 5 new customers, and cost per customer is $12,121
At an average of $1,500 per customer per month, that is $7,425 of new recurring revenue from one month of marketing. That is the contribution figure, and it is settled by the agreed rate rather than by what sales actually did.
Now the value side, where the two mistakes above usually appear:
- Average revenue per customer: $1,500 per month
- Gross margin: 50 percent, so $750 per month in contribution
- Retention: 48 months
- Lifetime value: $36,000, in contribution rather than revenue
Which gives the two numbers worth having:
- LTV to CAC: 3.0 to 1
- Payback period: 16.2 months, being $12,121 of acquisition cost divided by $750 of monthly contribution
Backward, from a target to a requirement
The same chain in reverse is how you set a marketing target that means something.
If the business needs 5 new customers a month, and the agreed close rate is 12 percent of qualified appointments, you need 41 qualified appointments. At 55 percent ICP fit, that is 75 held. At a 75 percent show rate, that is 100 appointments set.
That is the marketing target. It was derived, not negotiated, and every step of the derivation was agreed in advance by the people who will later be held to it.
The ratio flatters you. The payback period does not.
If your retention is long, and in contracted business services it usually runs for years rather than months, your LTV to CAC ratio will look excellent almost regardless of how efficiently you acquire customers. Stretch retention far enough and almost any acquisition cost produces a healthy looking multiple.
It is not lying to you. It is answering a different question from the one you need answered.
LTV to CAC tells you whether the business model works eventually. Payback period tells you whether you can afford to grow now. If it takes sixteen months to recover acquisition cost, then every new customer you add is a sixteen month hole in cash, and doubling your growth rate doubles the hole long before it doubles the return.
Companies do not usually die of a bad ratio. They die of a payback period they could not fund.
The lag nobody accounts for
There is a second error that survives even when the arithmetic is right.
In appointment-based sales, the meetings you book this month close over the following months. So comparing this month’s marketing spend to this month’s closed revenue compares two things that have nothing to do with each other. In a growing month it makes marketing look expensive. In a shrinking one it makes marketing look efficient. Both readings are wrong.
The fix is to measure by cohort. Take the appointments generated in a given month, follow that specific group through held, closed and retained, and compare the outcome to what that month cost. It takes longer to get an answer and the answer means something.
This is the same discipline as deciding a test’s sample size before you run it, which I wrote about in the piece on losing 31 of 59 tests. Decide what you are measuring and over what period, before the numbers start arriving and your preferences start selecting them.
What changed since 2024
The method above is unchanged in principle and completely different to operate.
In 2024 this was reconstructed monthly. Export from the CRM, export from the ad platforms, paste into a spreadsheet, reconcile the definitions by hand, argue about which column was right, and produce a number that was already several weeks old by the time anyone saw it.
Now the data lives in one place that is the source of truth and pushes to the CRM every hour. Cost per appointment, cost per appointment held and cost per customer are continuously available rather than assembled after the fact. Site visitor identification means an inbound account can be connected to activity rather than guessed at.
Two things follow from that, and only one of them is obvious.
The obvious one is speed. The useful one is that the definitions stopped drifting. When every number is rebuilt by hand each month, the definitions quietly change with whoever built it. When the pipeline is fixed, this month’s cost per held appointment is genuinely comparable to last month’s, and only then does a trend line mean anything.
I wrote about how the underlying work changed in moving a marketing team onto AI.
If you are starting on this
- Agree the definition of a qualified appointment first, in writing, with sales.
- Start counting held, not just set. You will not like the gap and you need to see it.
- Apply gross margin before you call anything value. Revenue is not contribution.
- Keep every figure on the same horizon. Monthly against monthly, or lifetime against fully loaded acquisition cost. Never one against the other.
- Track payback period, not just the ratio. It is the number that determines whether you can fund growth.
- Measure cohorts, not calendar months. Follow the group you paid for.
The target for marketing then stops being a number someone asked for and becomes a number the business requires. That is the entire point, and it is worth more than any individual metric in this article.
This article was substantially rewritten in September 2026. The original August 2024 version contained a calculation error: it subtracted one month of costs from six months of lifetime revenue, and it used revenue rather than contribution when calculating lifetime value. Both errors inflated the resulting value per appointment. They are corrected here, and described in the article as mistakes to avoid rather than quietly removed. The sections on the agreed ICP standard, cost per appointment held, payback period, cohort measurement and how the work is done now are new. All figures are illustrative.